
Visualize
Visit the Node Bible
Visualize
The Visualize SOP allows you to preview all sorts of things in your viewport. You can preview colors, attribute values, polygon vertex counts, uv distortion while having the ability to change the lighting, wireframe shading, and highlighted points for geometry. These changes only reflect in the viewport and are not part of your render.
Parameters:
Update Visualizers:
-- The visualize node will create a detail attribute called "visualizer," and this specifies any and all visualizers that have been applied to this geo stream. If you turn this on, it tells the node to add this detail attribute with a path to the node. If you leave this un-checked, then this information will not be appended to the list of visualizers.
Clear Incoming Visualizers:
-- If you're using multiple visualize nodes, then you can clear any entries within the visualizer detail atrribute which already exist by checking this on.
Wireframe:
-- The wireframe parameter overrides the display of wireframes in your viewport. Force shaded will force the obj to be shaded - even if you hover over the viewport and press w. Use viewport settings will do as it says. Force wireframe will force a wireframe shading.
Lighting:
-- This provides lighting overrides. Which allow you to preview something lit or unlit by the lights in your scene.
Show Points:
- This highlights points on your object. You can either select only the unconnected points (useful for troubleshooting un-connected points) or all points along the geo.
- This provides an override for previewing normal smoothing in your viewport. To keep things clean, I would advise against this parameter because it may interfere with normal smoothing that you may want to set later on in your network. All of these attributes exist in the detail context, and this is where the viewport goes to pick up this information. So, if you want to remove the "cusp angle" viewport override, then you'll want to delete the attribute in the detail context.
Visualizers:
---------
Here you can add multiple visualizers to your viewport. For more information about visualizer types in Houdini, please visit this link: https://www.sidefx.com/docs/houdini/basics/visualizers.html#types
---------
Active:
-- Enables a visualizer
Name:
-- The name of the visualizer that is stored in the "visualizer" detail attribute
Label:
-- This is the human-readable name for this visualizer when it appears in the interface.
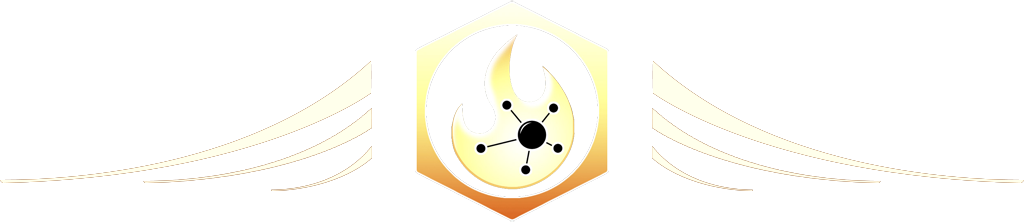
Type:
-- Marker
* For more information, visit: https://www.sidefx.com/docs/houdini/visualizers/marker.html
* Can create text, element index, point trail, vector trail, vector, or axes
* Text displays the value of an attribute
* Element Index displays the point number
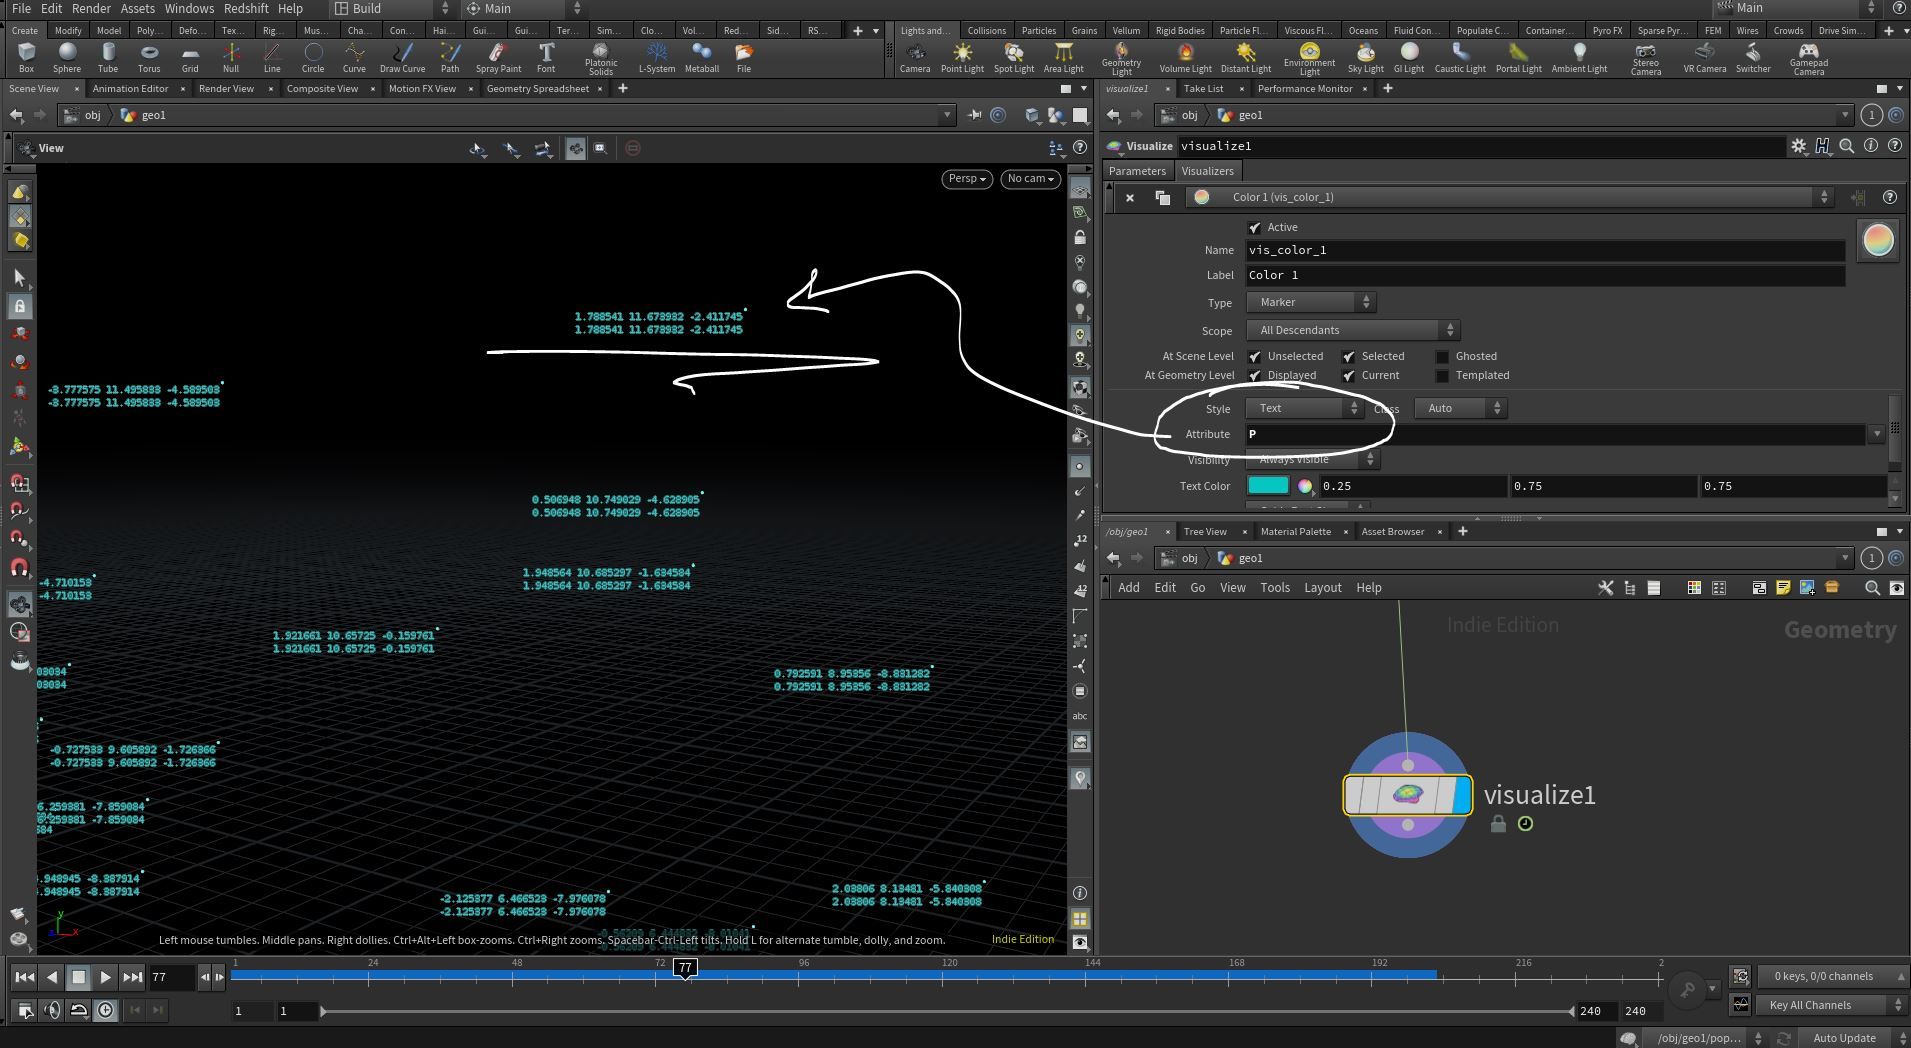
* Point Trail draws a line from the element’s location to the point contained in an attribute value. For example, visualizing the contents of a rest attribute would draw lines from the current point positions to their rest positions.
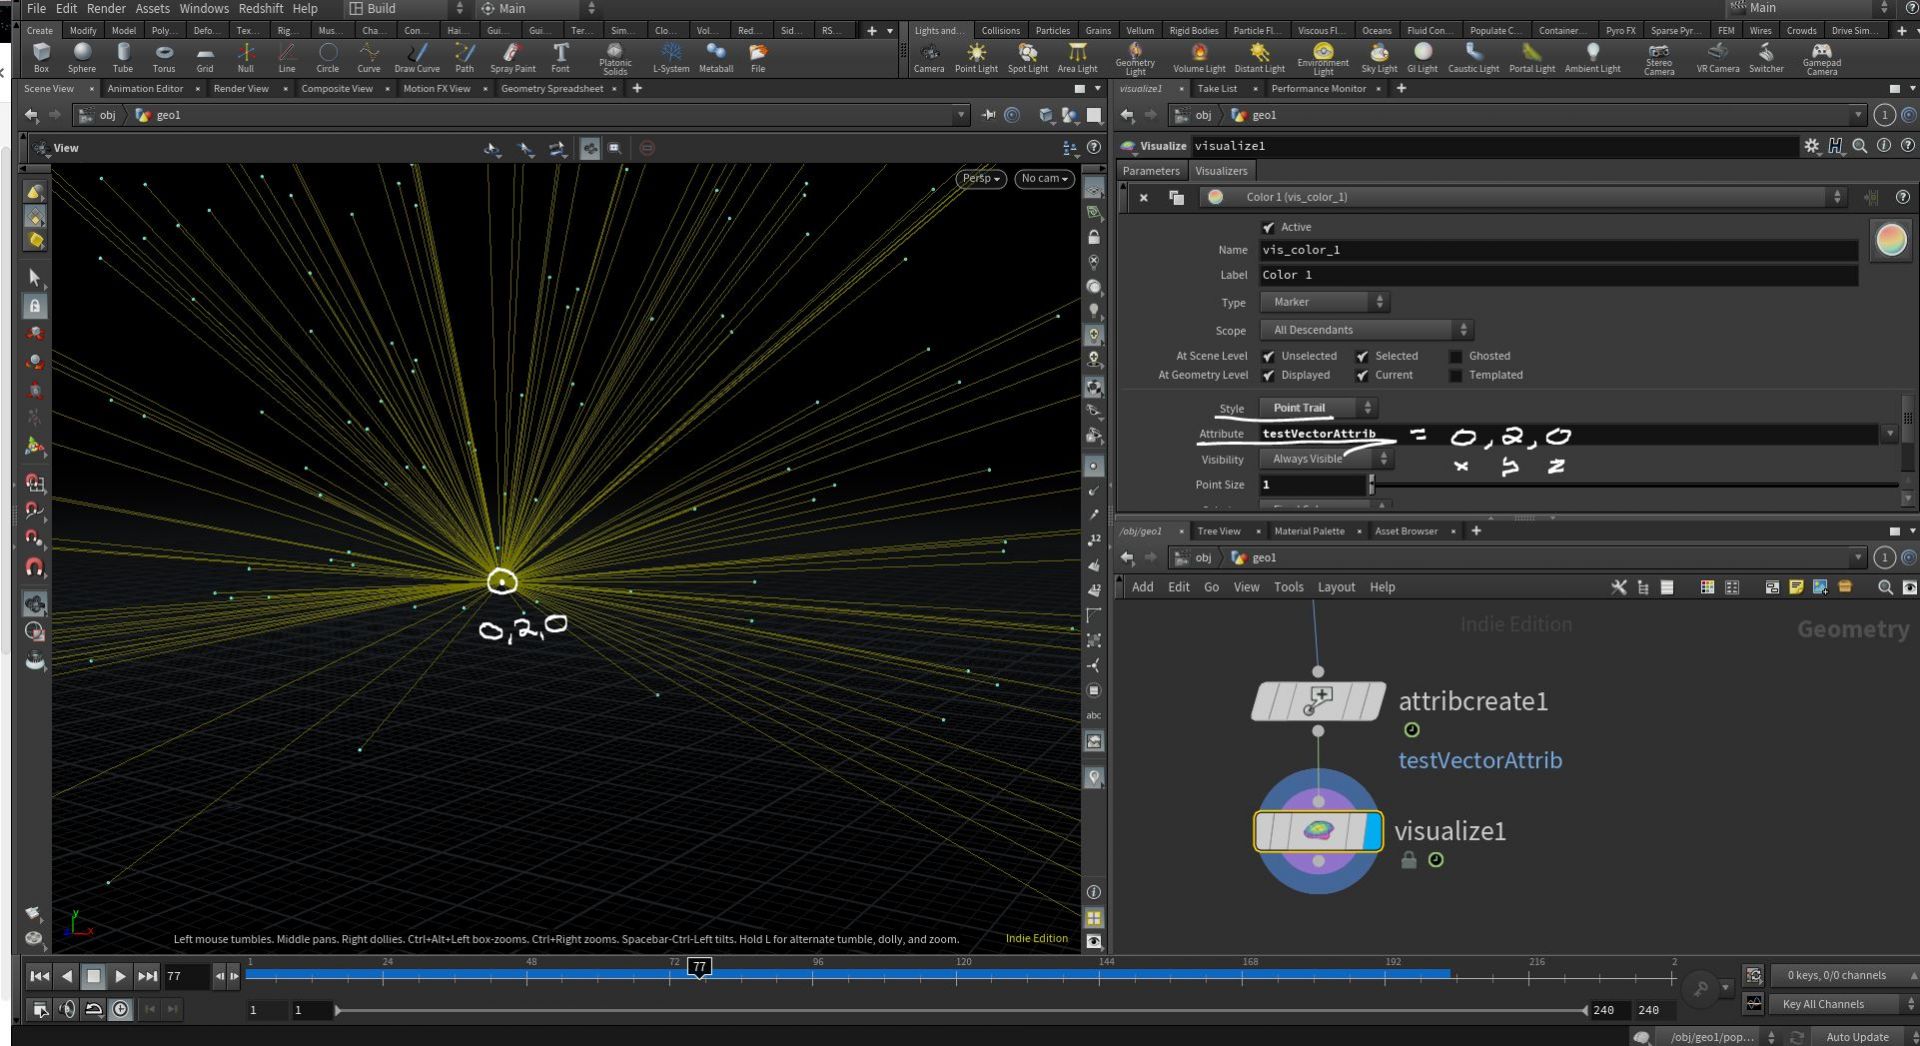
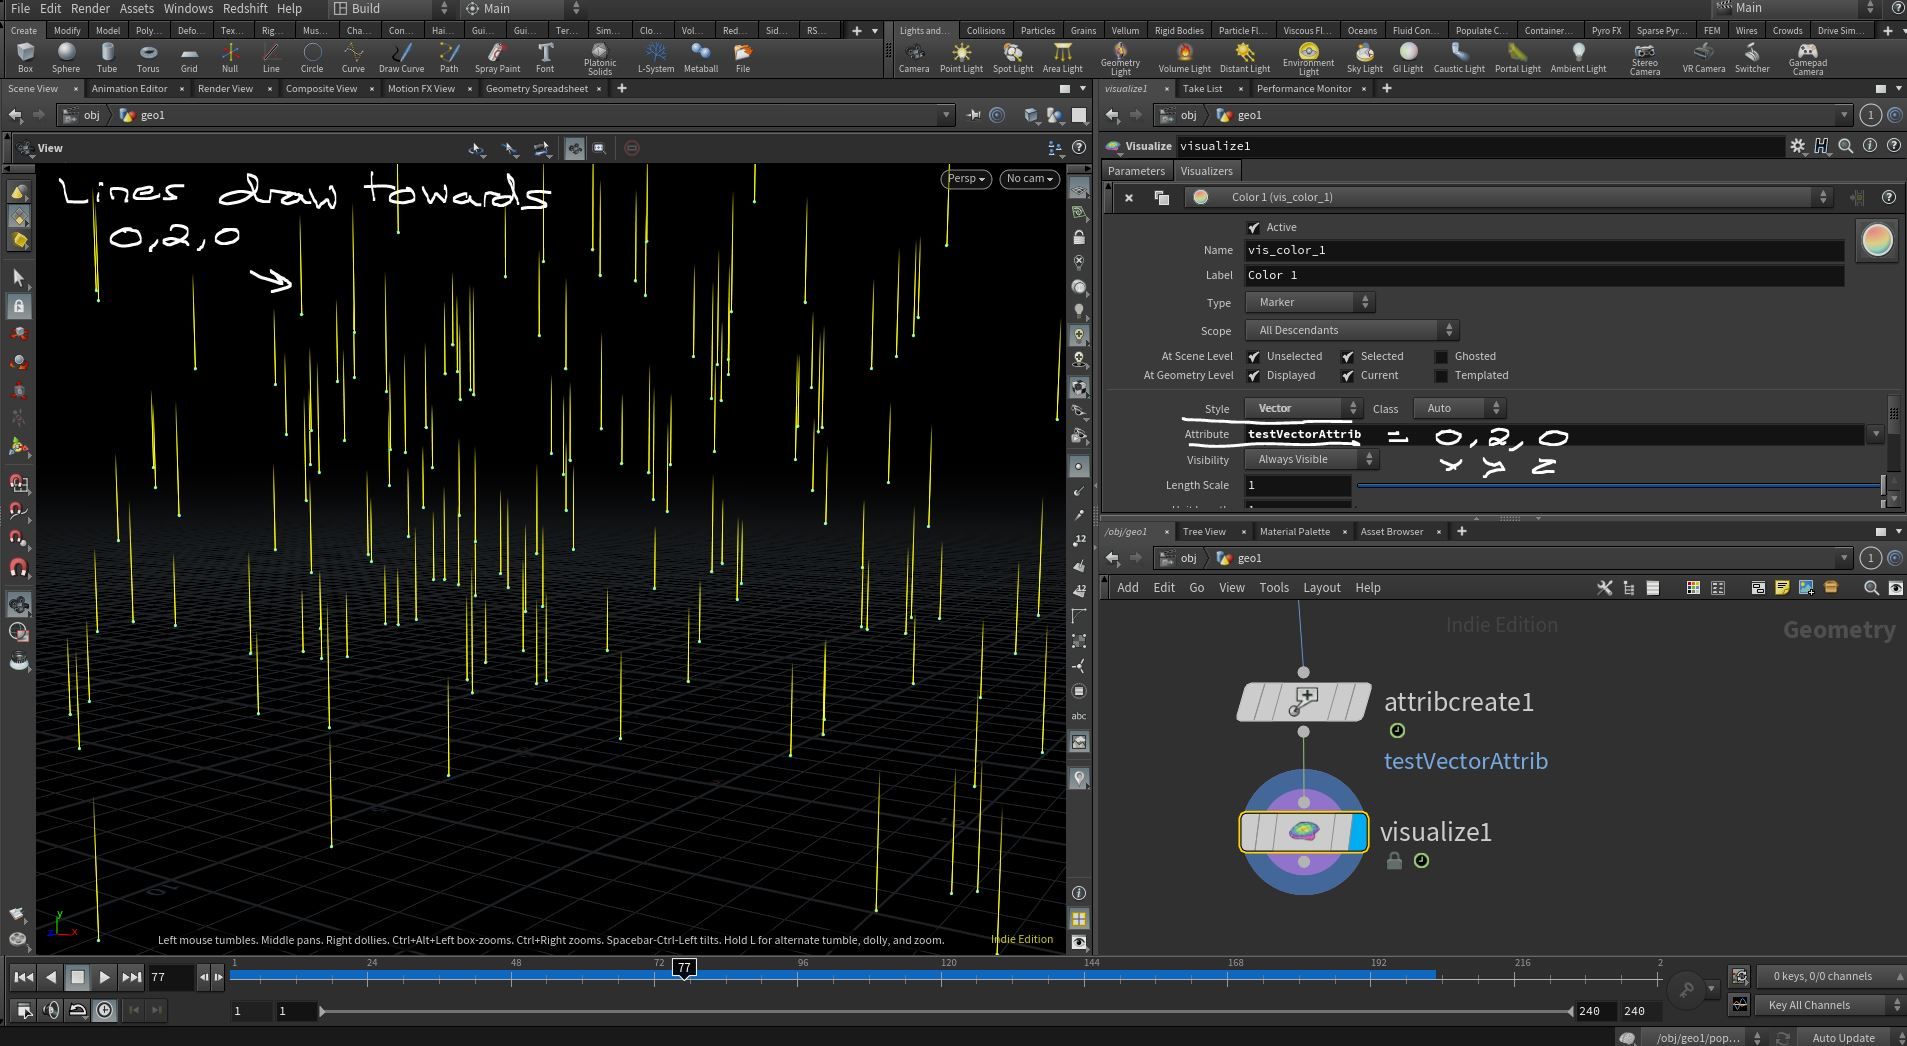
* Vector trail draws a line from the point based on a vector attribute value’s direction and length.
* Vector is the same thing as vector trail except the direction of the line is inverted.
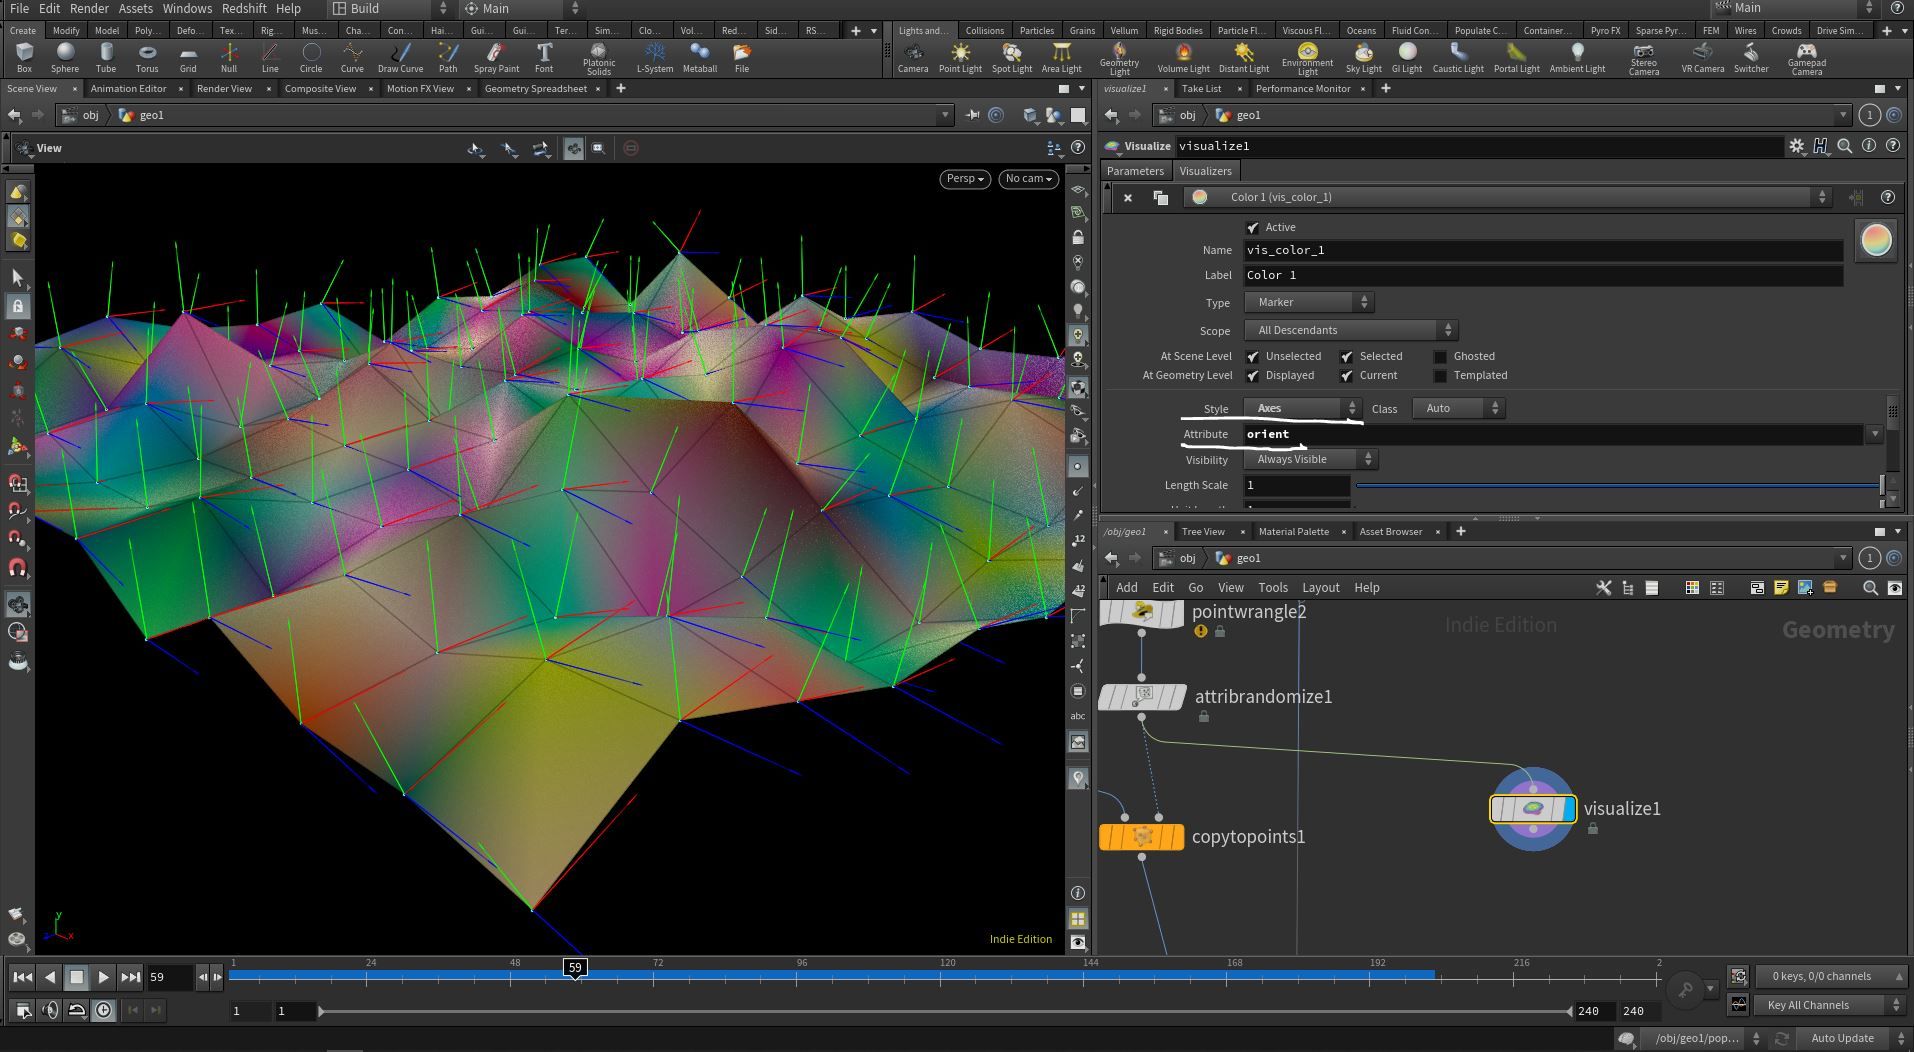
* Axes Draws a small set of axes at each element to visualize a matrix or quaternion attribute.
* For more information, visit: https://www.sidefx.com/docs/houdini/visualizers/color.html
* Colors your geometry in some way
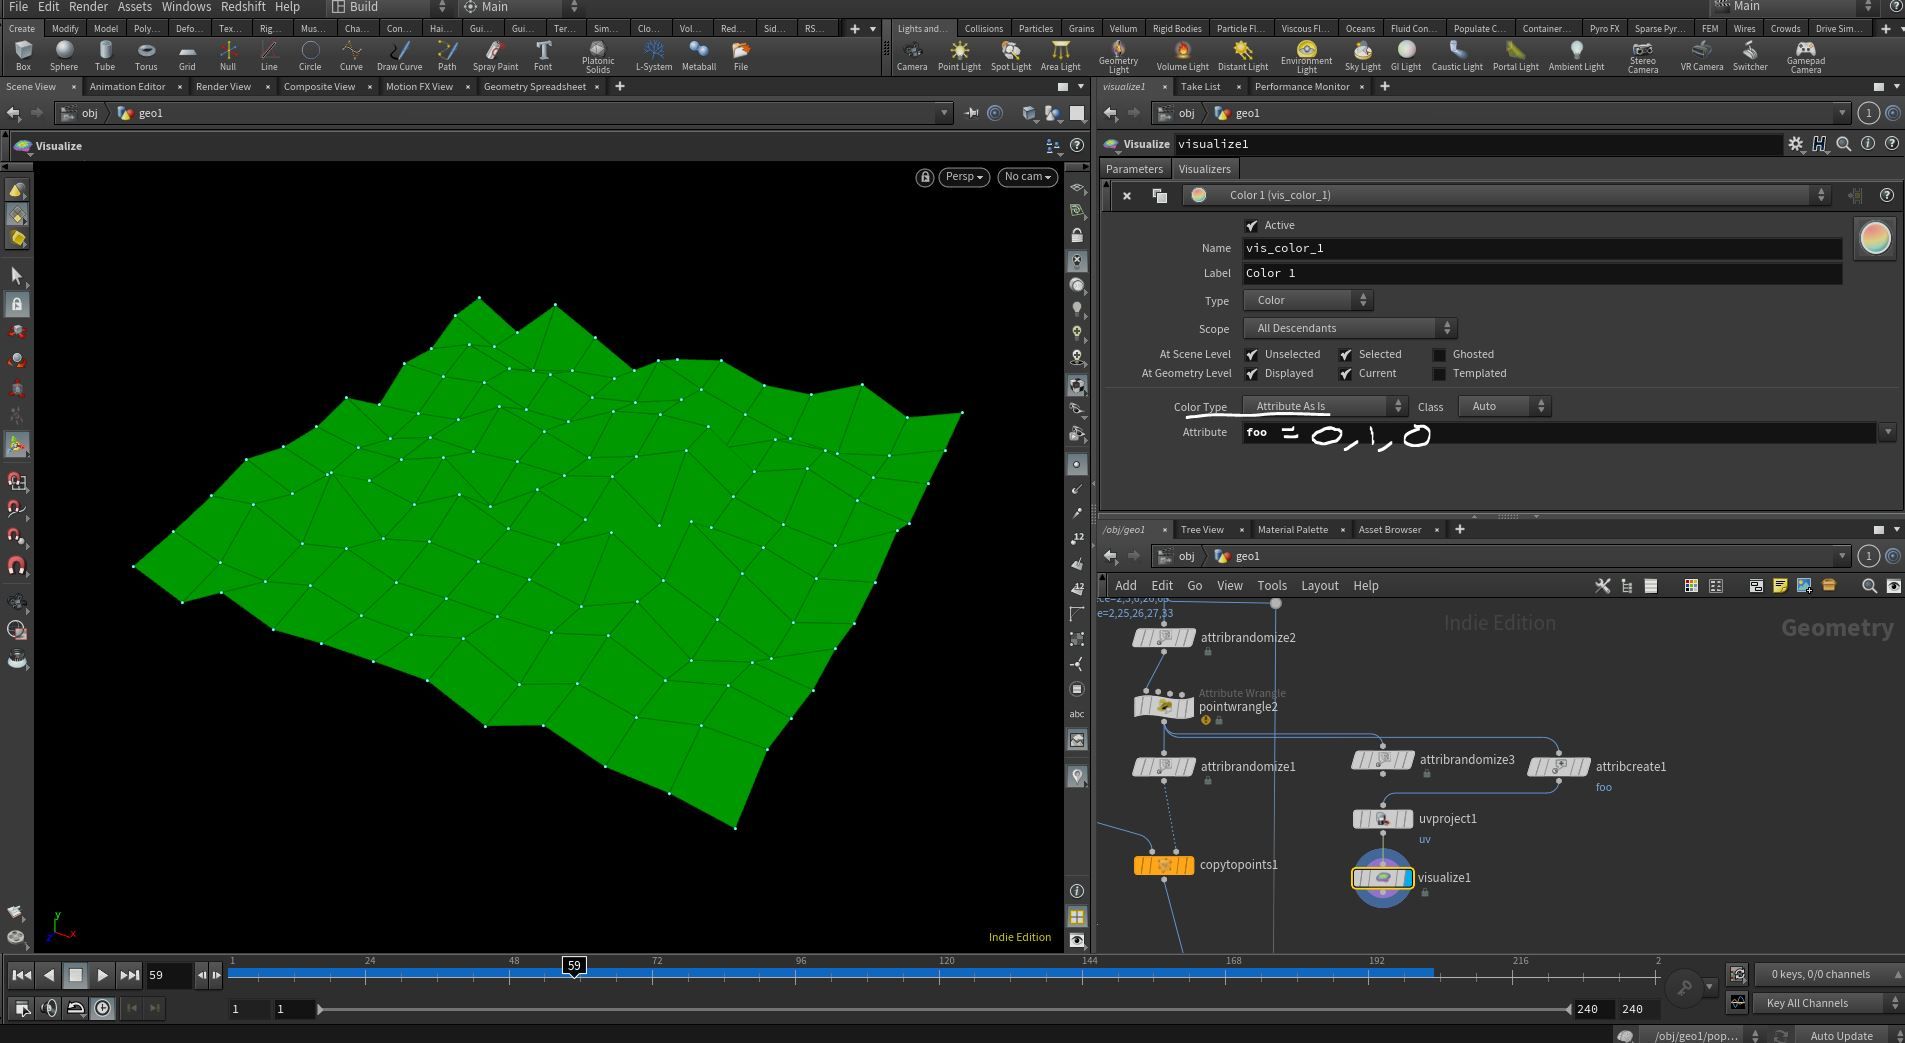
** Attribute as is = The value of the attribute is equal to the output color values. This only works properly with floating point attribute types. If the attribute has only one component, it is used as the red channel. If it has two components, they are used as red and green.
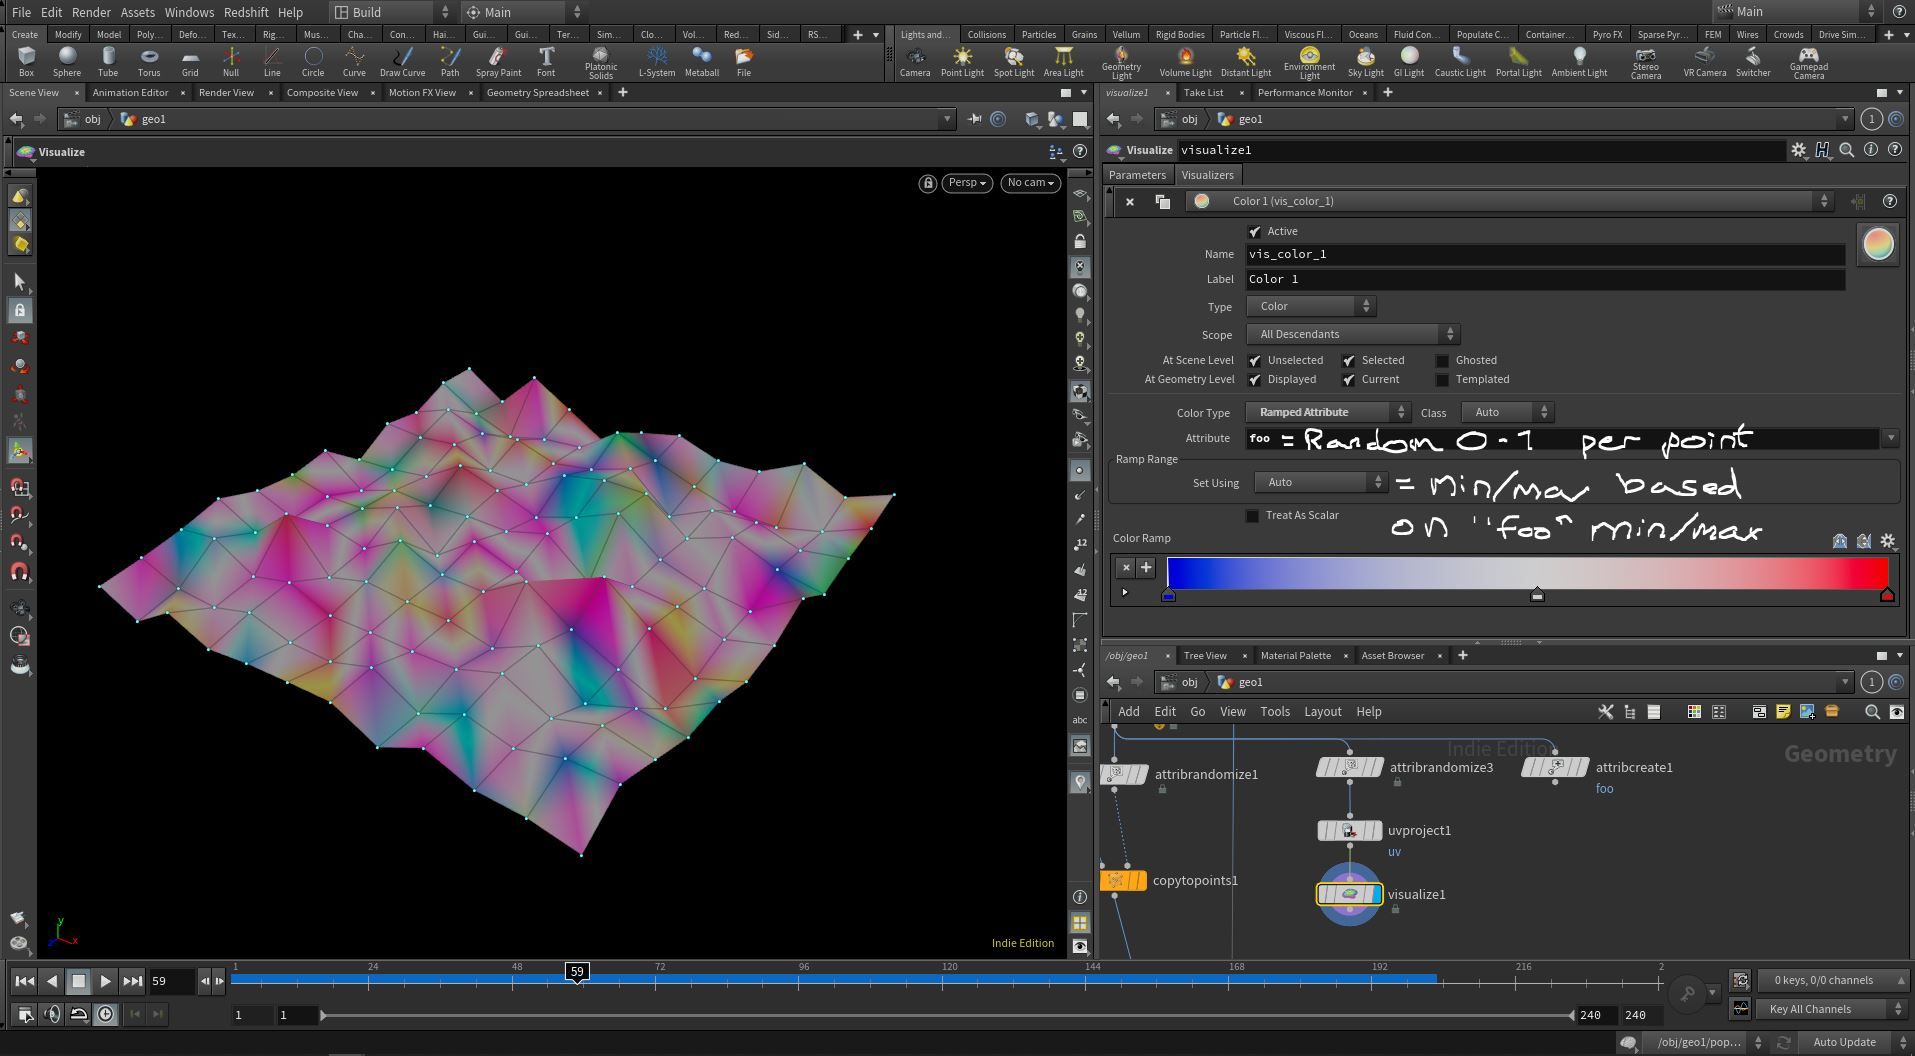
** Ramped Attribute = Will color the geo based on an attribute. The difference here is that you can control the colors that are assigned to the in-between values of the attribute. You need to specify a min/max range for this to work. You can do so by choosing.....
*** Auto - which looks at the min/max values of the attribute and uses that as the min/max of the ramp
*** Min/Max - which allows you directly specify min/max values on the ramp
*** Center and Width - which allows you to specify the center value and how far away the min/max is from that center value.
** On the Ramped Attribute, "treat as scalar" will allow you to specify a specific component of the incoming data if it is a vec2, vec3, or vec4
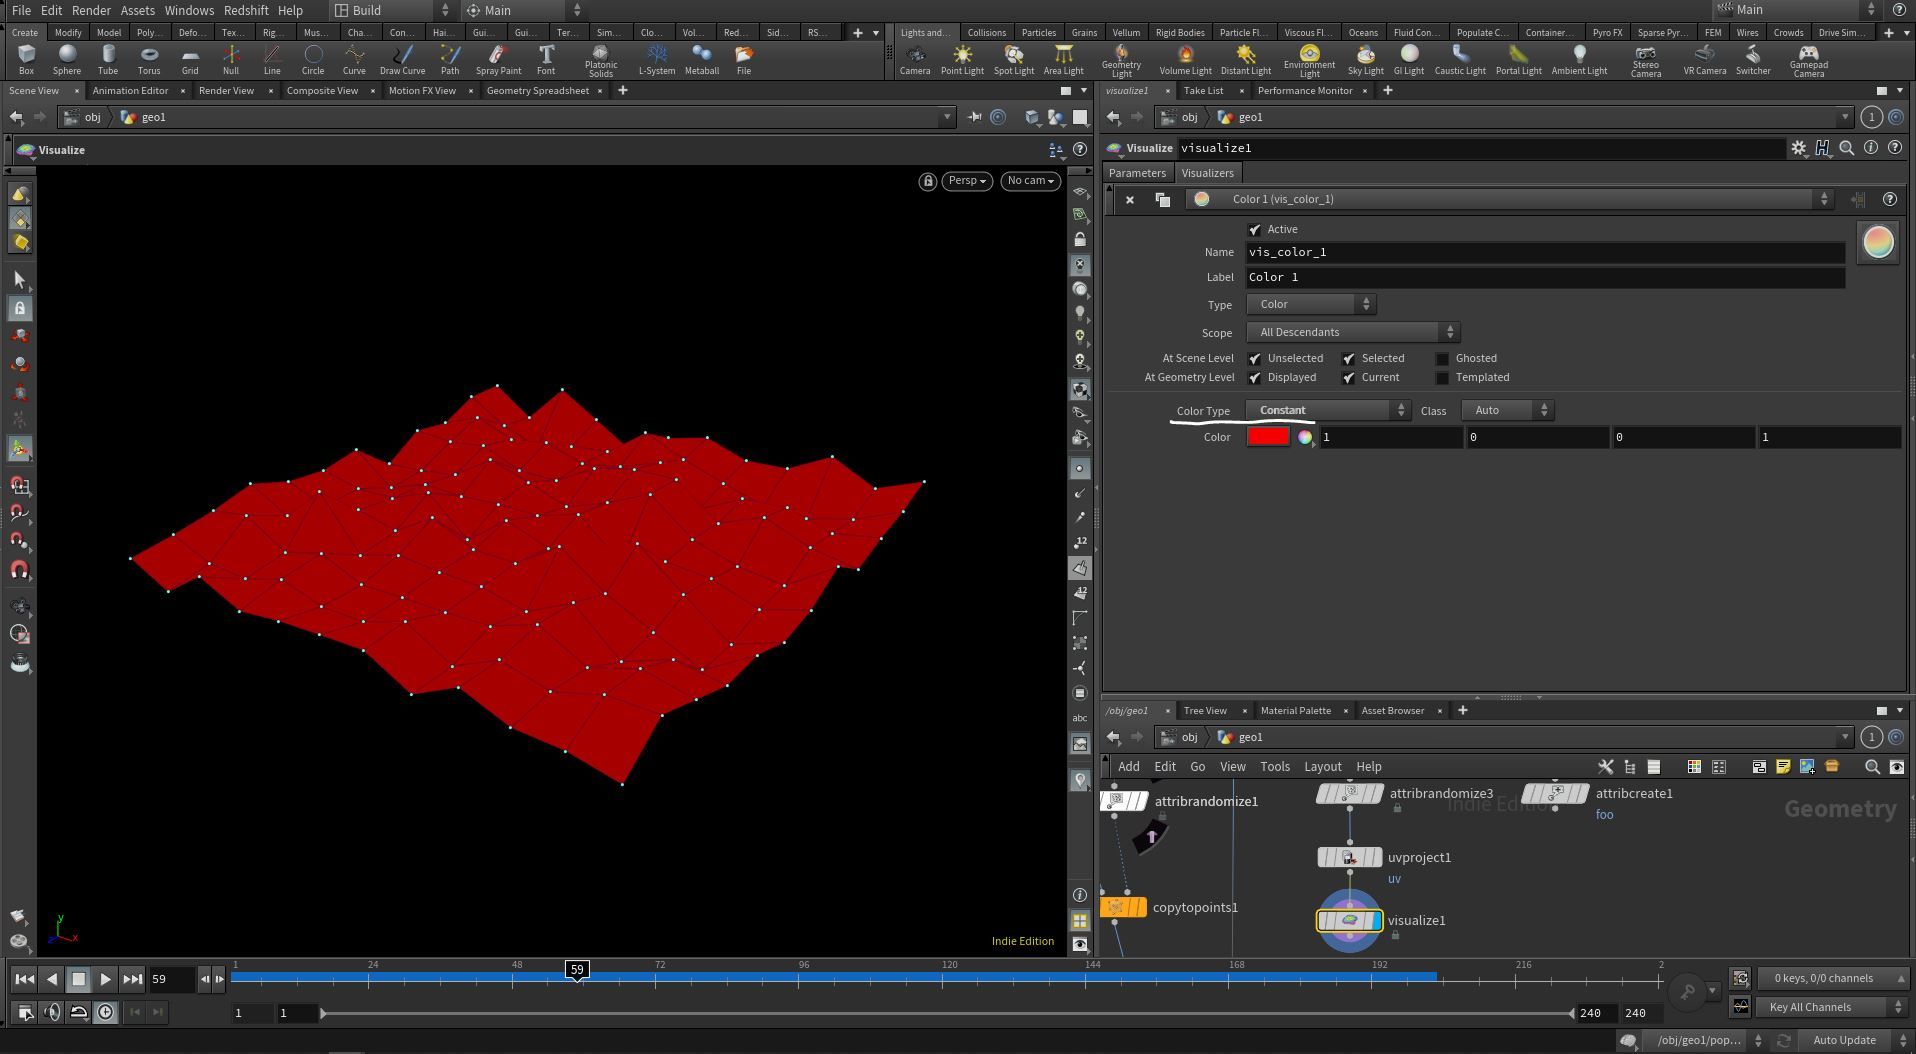
** Constant = a constant color
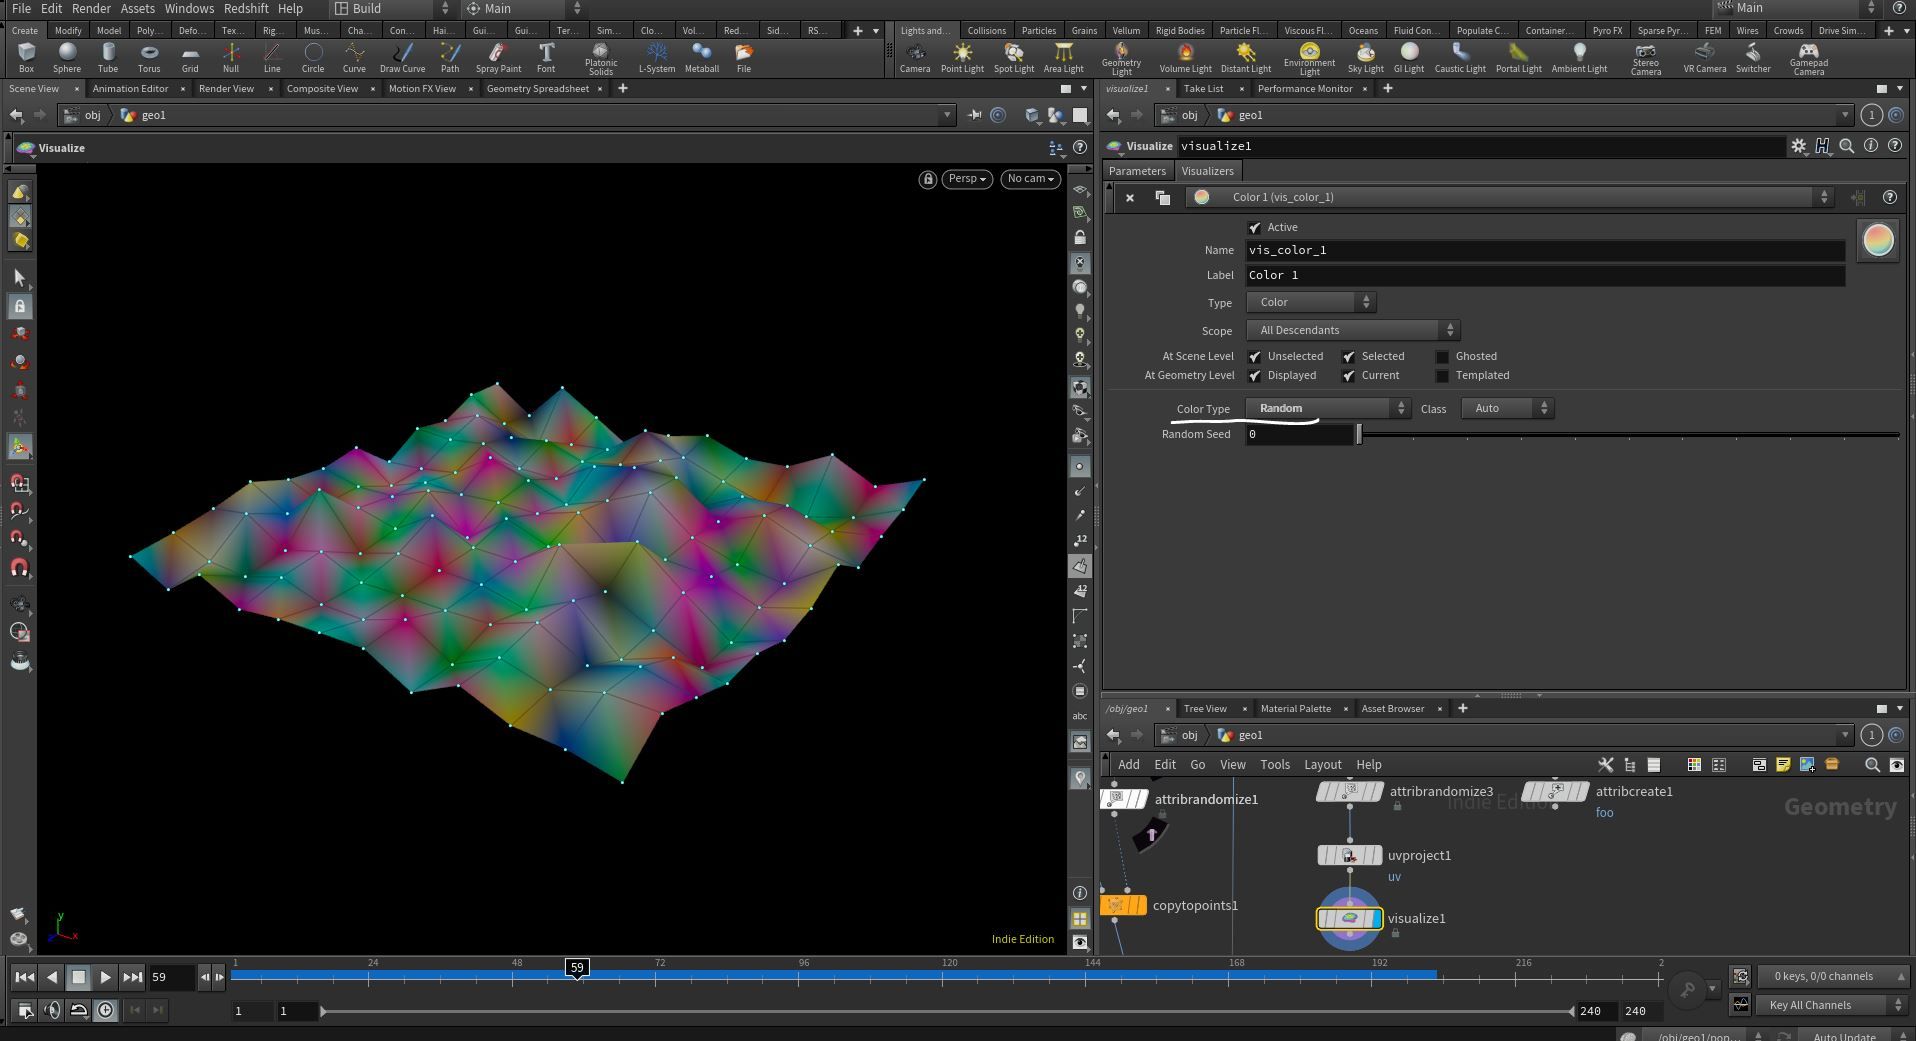
** Random = a random color for each point/prim
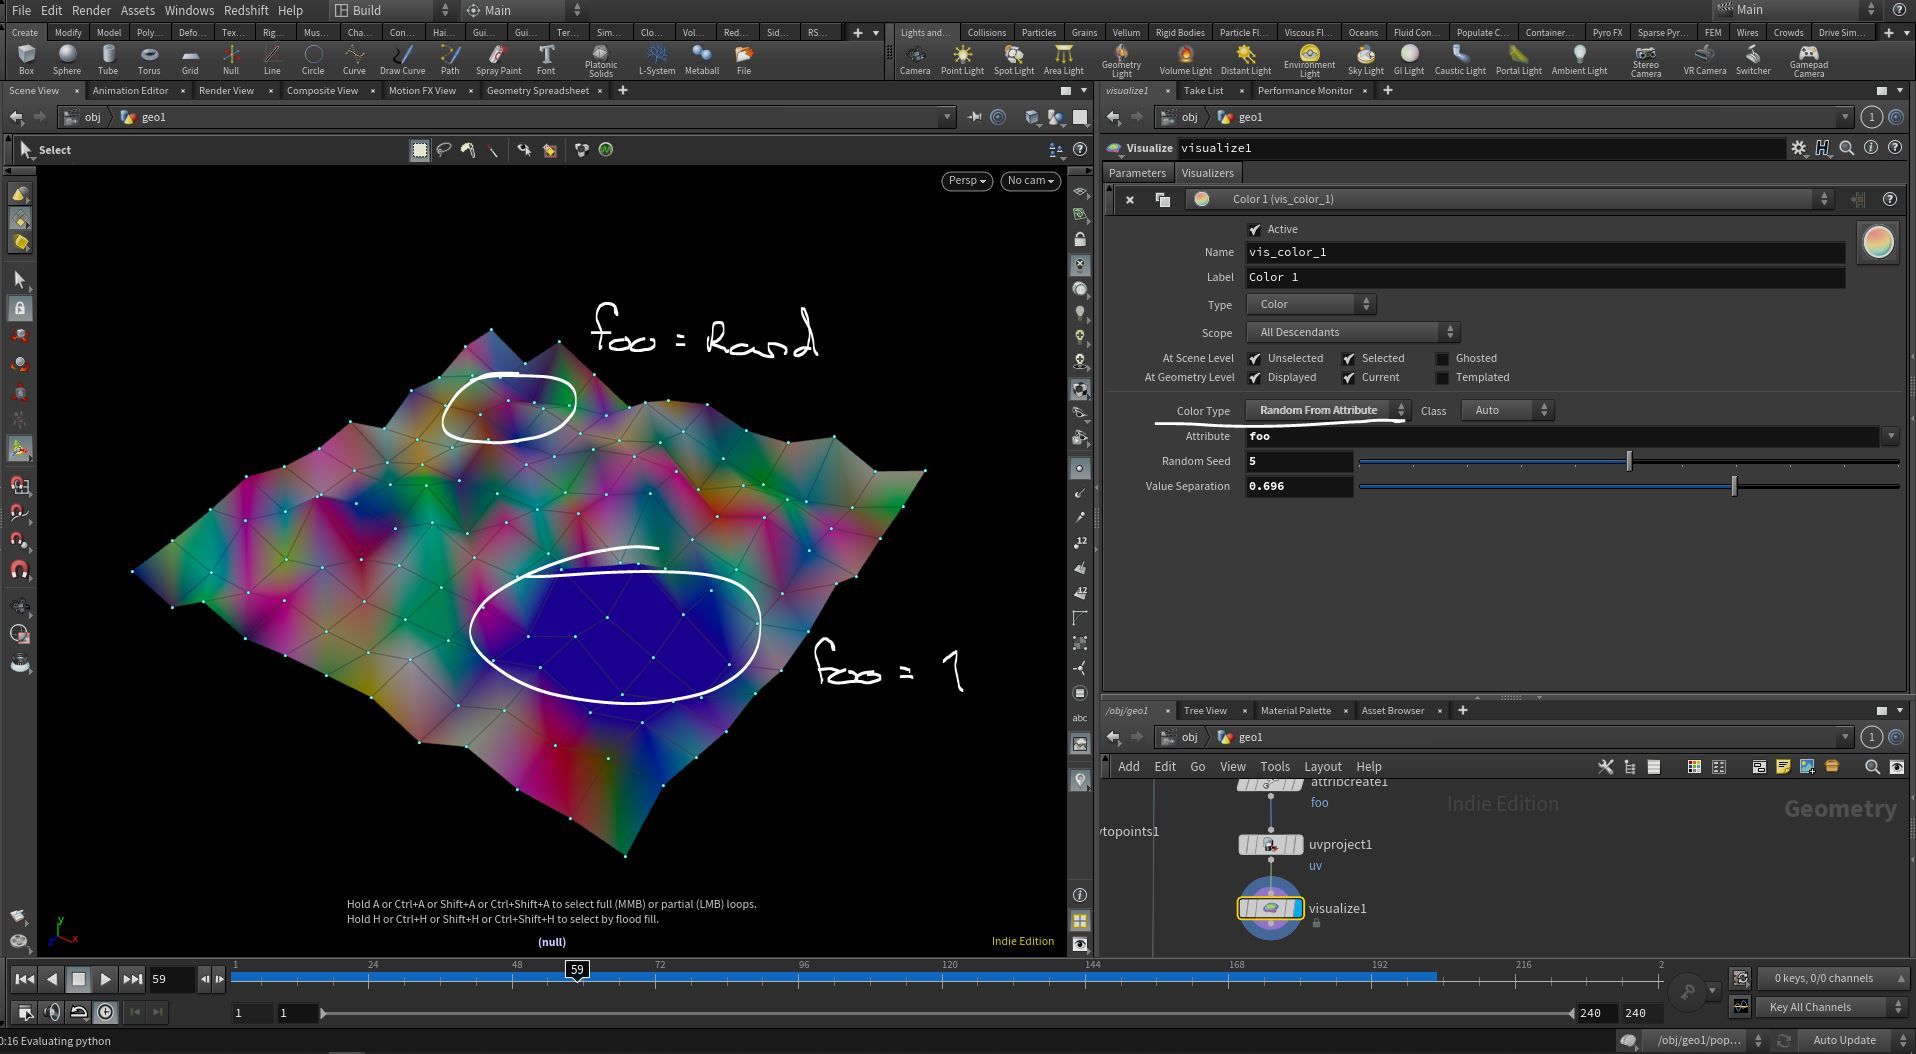
** Random From Attribute = A random color whose seed is the attribute value. As an example, if the attribute value = 200 on two points, then they would share the same random color.
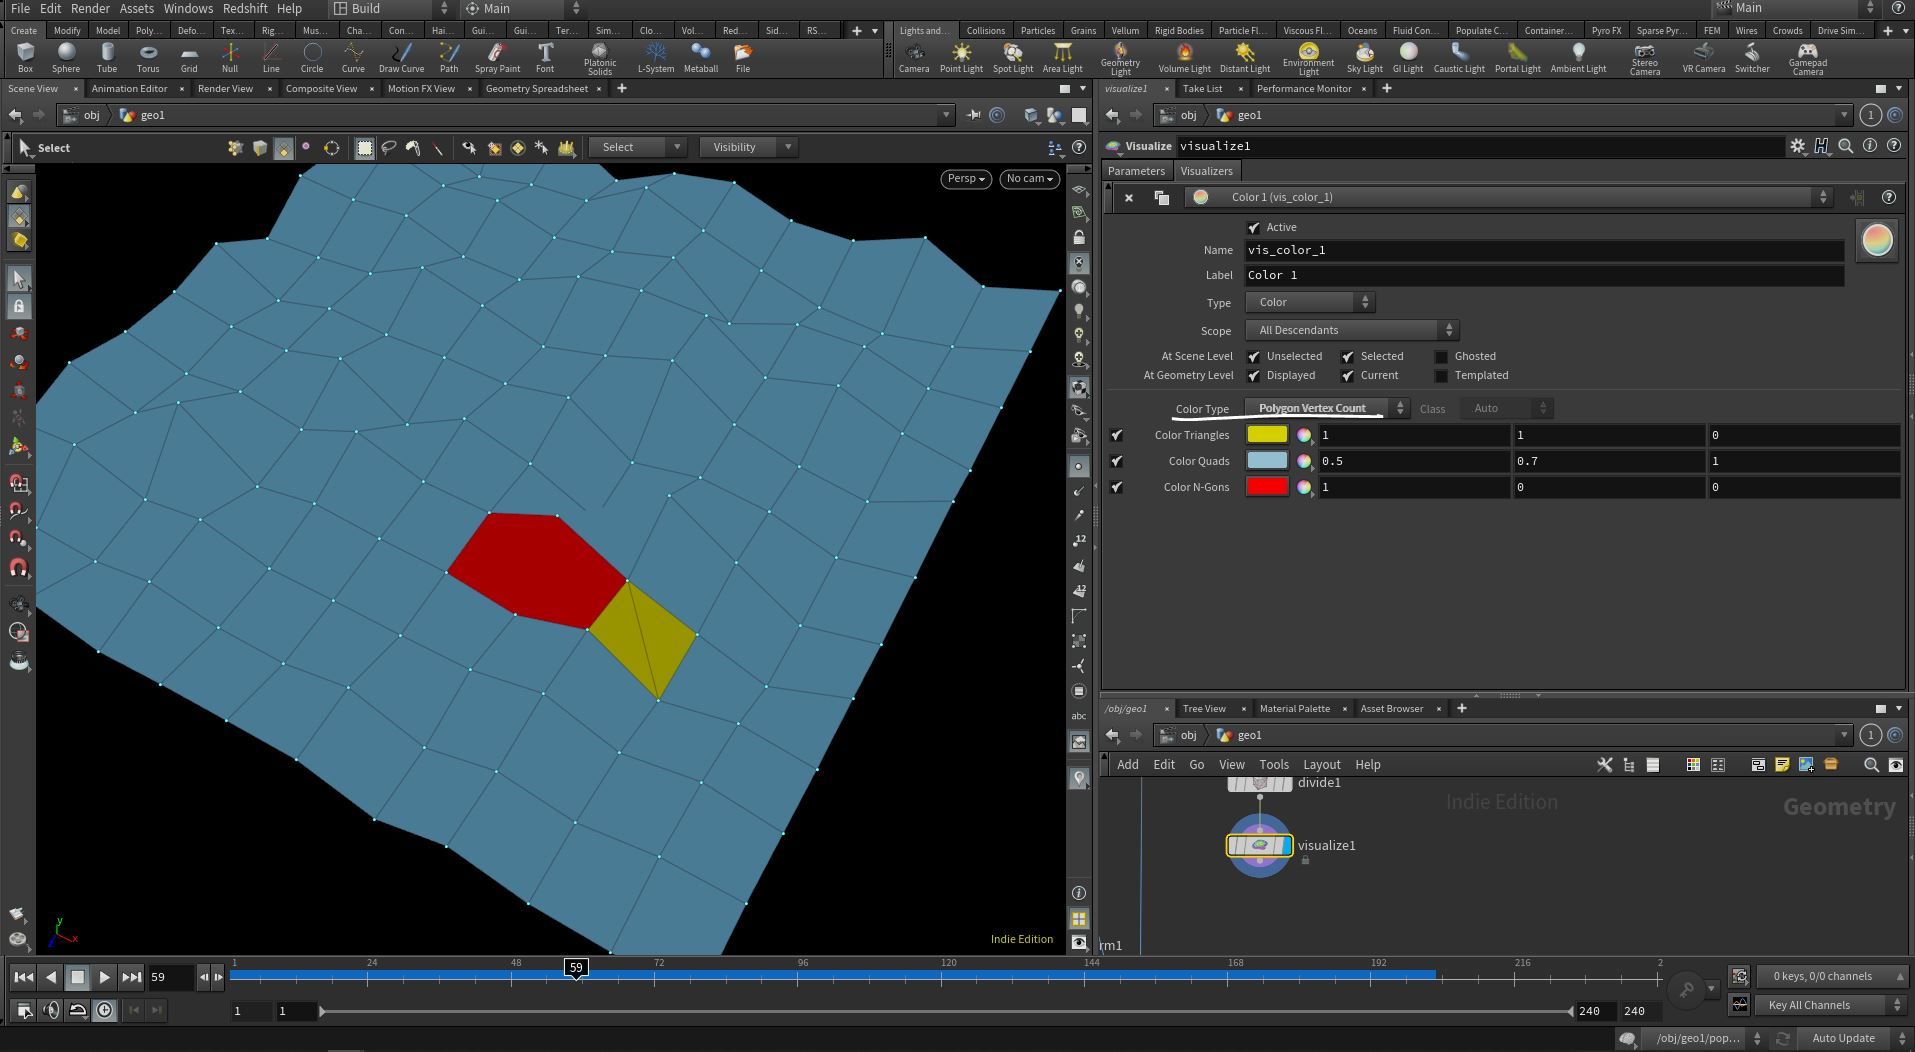
** Polygon Vertex Count = Colors the primitives based on how many sides a polygon has. Triangles are yellow, quads are gray, and n-gons are red by default.
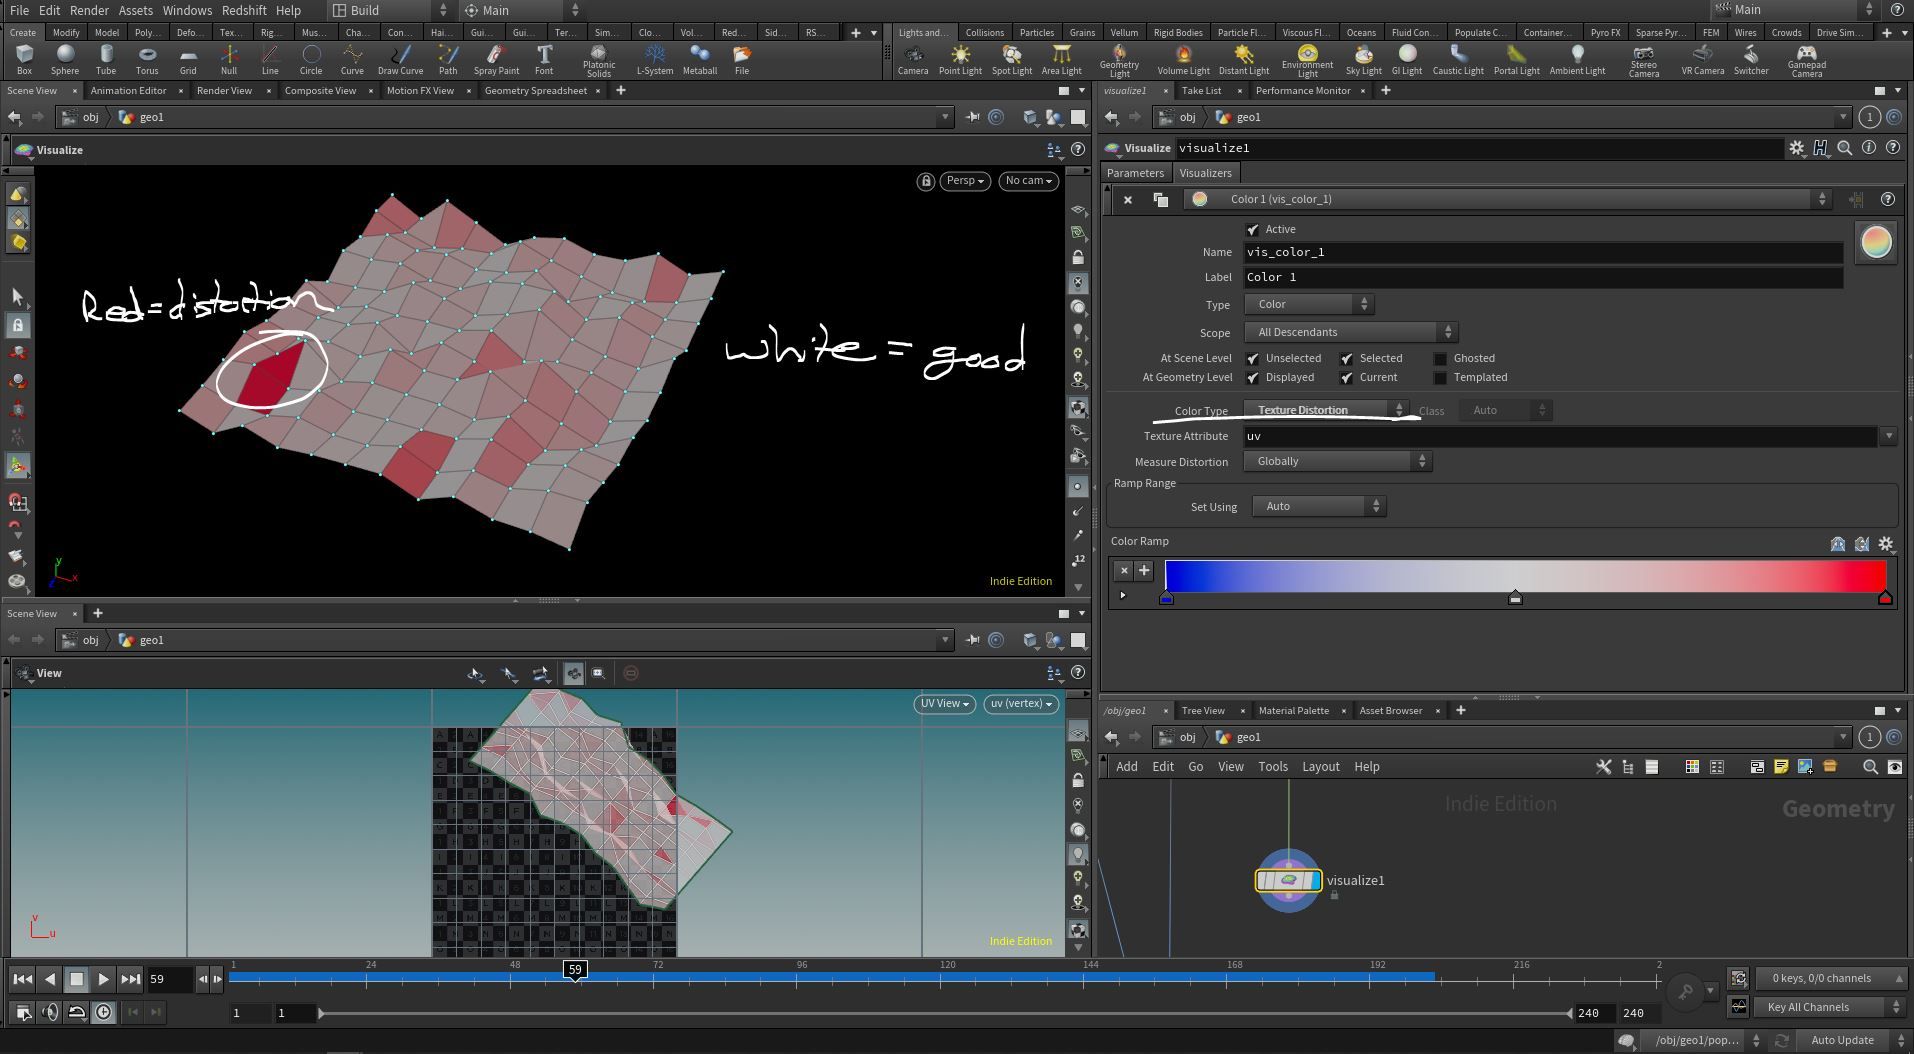
** Texture Distortion = Tint faces based on how much the texture is being stretched or squashed in that area.
*** Measuring distortion globally is the default - which allows you to measure the distortion in size from one island to the next. This is good to make sure that one island isn't too big compared to another island. If you say local to each island, though, then it won't look at the scale of the other islands when determining distortion. Finally, within polygons should be avoided unless you deem it necessary for some reason.
* The volume visualizer is designed to preview volumes. In general, it is advised to use other nodes when previewing volumes - specifically the volume visualization, volume slice, and volume trails SOPs because they are easier to control while attribute values are expressed in the geometry spreadsheet. In addition, the visualize node will not show you values which exist within the volume because the volume preview blocks any values from being read in the viewport. For this reason, it is best to refer to the other nodes when previewing volumes.
-- Tag
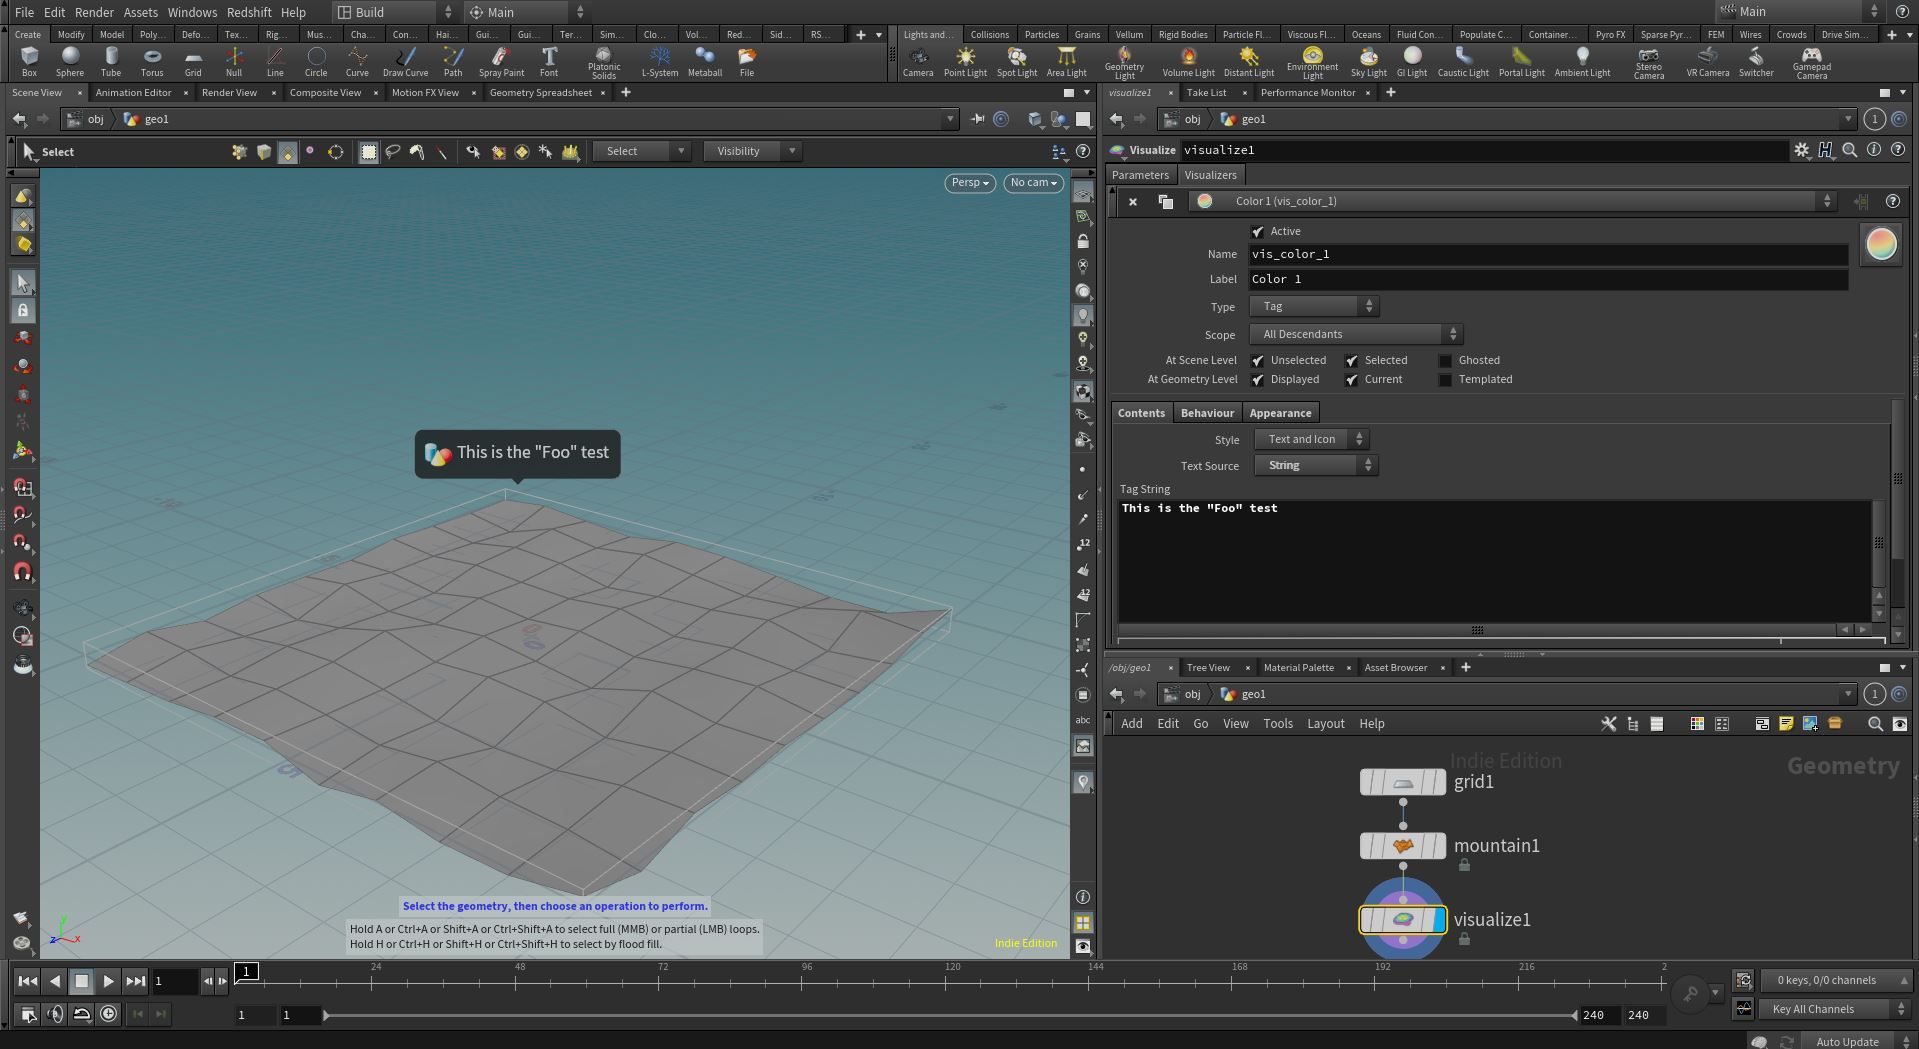
* The best way to familiarize yourself with the tag node options is by playing with them in the visualize node. These settings are fairly straight-forward, but please refer to this video if you'd like further information.
Write your awesome label here.
* There is no documentation or settings for this parameter... so who knows?
-- Capture Weights
* This is useful when rigging because it allows you to visualize the captured weights. These weights can relate to one particular capture region or all captured regions. Online documentation does not exist for these settings.
------------------
This concludes the "Type" parameters
------------------
Scope:
-- The scope determines which nodes this visualizer is allowed to apply to. In practice, these parameter do not seem to work as intended. If you want the visualization of something to transfer to its descendants, then it's best to use the "update visualizers" checkbox. However, according to the user docs:
-- Node Only
-- Same Network Type Descendants
-- All Descendants
-- Global
At scene level/At geometry level:
-- Use the checkboxes to choose whether the visualizer applies to unselected, selected, and/or ghosted geometry.

Featured links

About Mentorship Calls
As a premium subscriber, you'll receive an email once a month with all the info necessary to schedule your call.
Study Plan Call
Look at the welcome email for further instructions on how to schedule a call if you are a Premium Subscriber.
Premium Member Discord
Unlike the standard discord server, the Premium Member server receives faster replies, feedback on projects outside CG Forge courses, and exclusive discounts on mentorship calls that aren't offered anywhere else.
Houdini Education License
In summary, the educational license of Houdini acts much like Houdini Indie - but at a discounted price. The main difference between Indie and Education is that this version of Houdini cannot be used for commercial projects. It's great, however, for learning and preparing a demo reel without the limitations of Houdini Apprentice.
Unlock Resources
One of the best examples of this is the Node Bible. This resource acts like an encyclopedia of Houdini knowledge. Each entry features a node, goes through all the parameters, and offers video quick tips on how to use each node. The Node Bible goes beyond the native Houdini documentation because it's easier to understand, offers practical examples, and links up to nodes that get used in the courses.
In the resource sections, you'll also find quick tips that cover a variety of miscellaneous topics along with The Weekly Wrangle - which is a series dedicated to advice and real-world conversations surrounding career success.
Redshift Discount
https://www.maxon.net/redshift
Aug 28th, 2024 Changelog
General Changes:
• New, simplified website design is now live!
◦ All new particle banner is featured on the home and after login pages
◦ The after-login page now features courses that are sorted by ones that you have recently watched. This makes it easier to continue watching whatever you’ve been working on without scrolling through all the courses to find what you’re looking for.
◦ There is also a new “resources” section that can be found beneath the “Browse Courses” on the after-login page. This makes it easier to bring up the Node Bible, the “Tips + Tricks,” or Weekly wrangle in a new tab
◦ “CG Forge Academy” has been replaced with a “Mentorship Calls” at the top menu (see below for more details)
◦ The resources dropdown now features “Tips + Tricks” (see below for details)
◦ Certification requirements have been slightly re-written to be easier to understand
◦ Subscriptions have been re-designed from the ground up (see below for details)
Subscription Changes:
• Subscriptions have changed to include a "Basic Subscription" and a "Premium Subscription" option. The Basic Subscription renews monthly, and the “Premium Subscription” renews every 4 months. Yearly subscriptions have been removed.
◦ These changes only affect new subscribers. Existing subscribers will not see anything change with their auto-renewal amount.
◦ 10% off a Redshift yearly subscription is now included with the Premium Subscription. (If you are currently a 4 or 12 month subscriber, then just email support@cgforge.com for this)
◦ A new “Study Plan” call has been added to the Premium Subscription. (If you are currently a 4 or 12 month subscriber, then just email support@cgforge.com for this)
◦ A Houdini education license is now available for “Premium” subscribers. (If you are currently a 4 or 12 month subscriber, then just email support@cgforge.com for this)
◦ For more information, visit the subscriptions page.
• CG Forge Academy has been redesigned to be easier to use.
◦ 45 minute calls have been removed. Existing coupons are still valid and can be used towards 90 minute sessions for the amount listed on each coupon.
◦ 8 week mentorships have been removed - Instead, you can book as many 90 minute calls as you’d like.
◦ Free onboarding calls have been removed - Instead, premium subscribers now receive a complimentary “Study Plan Call” that establishes a personalized curriculum moving forward.
◦ The “CG Forge Academy” top menu is now replaced with “Mentorship Calls” and only allows for booking 90 minute calls.
All new “Tips and Tricks” resource page:
• “Tips and Tricks” is now a resource page that holds all quick tips, Houdini update videos, and other miscellaneous videos in one place. If you’re looking for “Quicktips Season One and Two” or "Houdini 19 Updates" they have now migrated over to the “Tips and Tricks” resource section.
Discord changes:
• The CG Forge Discord channel will now be divided into two categories: “Basic Members” and “Premium Members.” The premium member channel will be invite-only to premium subscribers or those who are currently enrolled in a 4 or 12 month subscription. If you eligible to join the premium discord channel, email support@cgforge.com for an invitation.
◦ Basic Discord members will no longer receive support for projects that are outside the topic of CG Forge courses.
◦ Premium Discord members will receive support for projects outside of CG Forge content
◦ Premium members will receive discounts on mentorship calls, and basic members will not.
◦ Premium members will have their questions / posts answered before basic members
◦ Early access to courses will now be exclusively provided to premium members via the discord channel.
If you have any further questions about these changes, feel free to email support@cgforge.com
Cheers,
- Tyler
1:1 Support and Feedback
Unlock ALL Courses
Instead of paying lots of money for ONE course, you can pay less for a library of courses.
With CG Forge, you can also count on highly refined content that's conveniently found in one place. This makes it easy to cut through the clutter of Houdini tutorials out there and make the most of your time while you learn.
Disturbance
"The disturbance force introduces small amounts of change, mimicking the effects of localized environmental change. This localized change in momentum cancels itself out over time, preserving the simulation’s general motion and overall shape."
In practice, disturbance is great at capturing smaller details in a pyro sim. It's not as great at capturing larger movements and details. Artists will often use disturbance to break up mushroom shapes that occur along the leading edges of smoke simulations or to add tiny bits of detail in general.
Disturbance has two primary modes: Block-based and Continuous. Block based gives you better control over how large the detailed shapes are. The block size is represented in meters, and the larger the size, the larger size the randomized forces are on the pyro. Continuous will provide a fuzzier, smaller-detailed look, and it is often better to use when trying to soften the overall look of a pyro simulation. Continuous mode can be useful when representing avalanches or areas of mist along a waterfall.